Welcome to coranking’s documentation!
coranking is a tiny library for calculating the coranking matrix and associated metrics. This can be used to assess the quality of a lower dimensional embedding of a higher dimensional space. The definition of the coranking matrix and the derivation of each of the metrics from the coranking matrix can be found in this paper:
Lee, John A., and Michel Verleysen. “Quality assessment of dimensionality reduction: Rank-based criteria.” Neurocomputing 72.7 (2009): 1431-1443.
Usage Examples
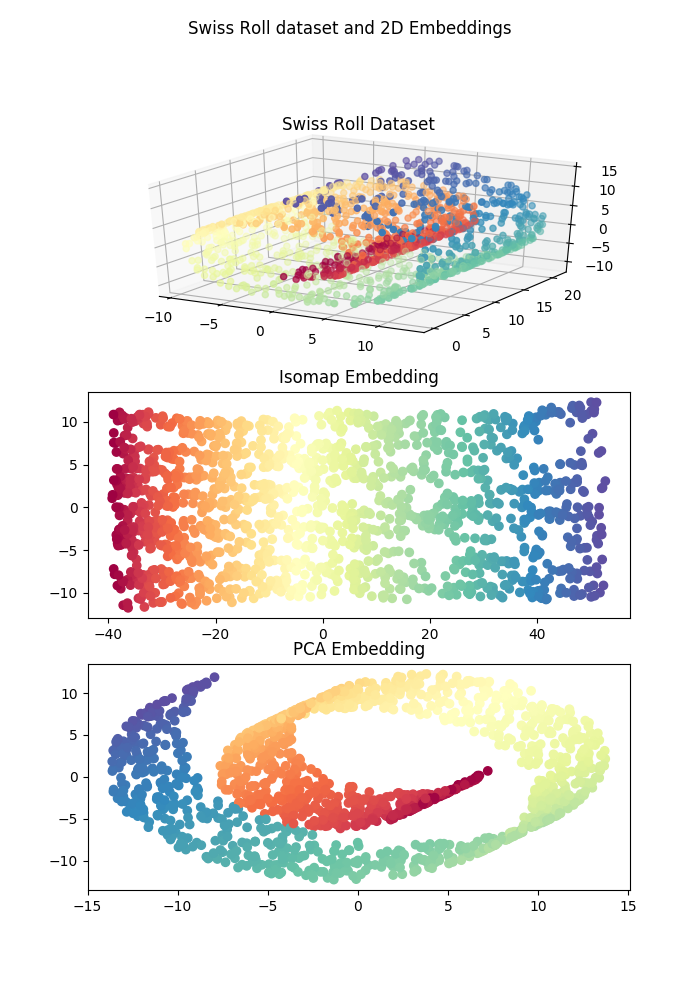
First lets generate some data and then produce some embeddings in a lower dimensional space. In the example, the swiss roll dataset is embeded in 2D using two dimensionality reduction algorithms: Isomap and PCA.
from sklearn import manifold, datasets
from sklearn.decomposition.pca import PCA

X, color = datasets.samples_generator.make_swiss_roll(n_samples=1500)

# Generate Isomap embedding
isomap = manifold.Isomap(n_neighbors=12, n_components=2)
isomap_embedding = isomap.fit_transform(X)

# Generate PCA embedding
pca_embedding = PCA(2).fit_transform(X)
This produces a dataset and projections that look roughly like th following:
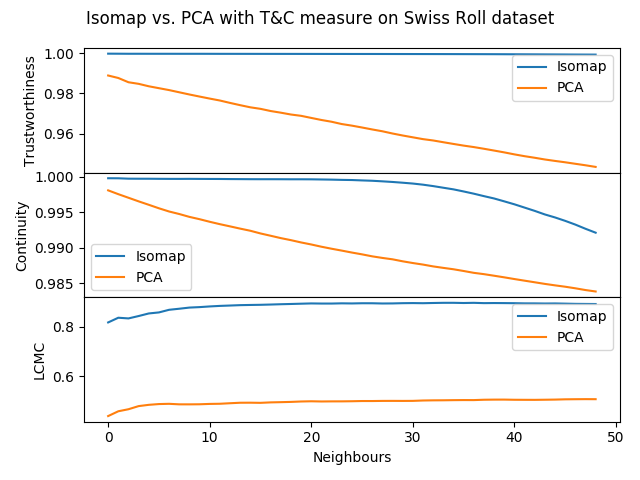
Using the coranking library various metrics quantifying the quality of the lower dimensional embedding can be computed. In the following code the trustworthiness, continuity, and LCMC metrics are computed for each of teh Isomap and PCA ebeddings of the data for the first 50 neighbours.
import coranking
from coranking.metrics import trustworthiness, continuity, LCMC

Q = coranking.coranking_matrix(X, isomap_embedding)

trust_isomap = trustworthiness(Q, min_k=1, max_k=50)
cont_isomap = continuity(Q, min_k=1, max_k=50)
lcmc_isomap = LCMC(Q, min_k=1, max_k=50)

Q = coranking.coranking_matrix(X, pca_embedding)

trust_pca = trustworthiness(Q, min_k=1, max_k=50)
cont_pca = continuity(Q, min_k=1, max_k=50)
lcmc_pca = LCMC(Q, min_k=1, max_k=50)
Plotting the results of the metrics shows that Isomap clearly produces a higher quality embedding compared to PCA, reflected in the two dimensional plot in the figure above.